Mobile Executive Dashboard
Key Business Metrics Structured data Interactive charts Notification center
The Problem
Executive information support is one of the factors that determine the effectiveness of operational decision making and control of their implementation.
Executive information base is multidimensional and is formed from different sources: production, commercial and financial data comes from the enterprise management systems, analytical reports are generated by requests or special decisions, operational reports are received by e-mail or in instant messengers, important information can also come from external sources.
It is difficult to organize executive information support in the field, on the go, out of the office based on standard office information systems because that they are not adapted to present data in a convenient form for organizing effective work on the mobile device.
Mobile Executive Dashboard is a mobile decision making support system of Executive, installed in his smartphone.
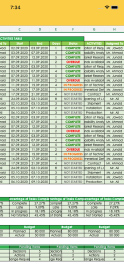
The mobile dashboard allows to convert standard spreadsheet files with key performance indicators to structured data screens with interactive charts and notification systems.
Mobile executive dashboard implementation does not require reengineering of business processes and adapts to existing forms of reports, providing a new quality of work with them on mobile devices.
Information from the mobile dashboard can be broadcast to widescreen TV panels during meetings.
Mobile executive dashboard requires an internet connection only to update data.
Mobile Dashboard Structure
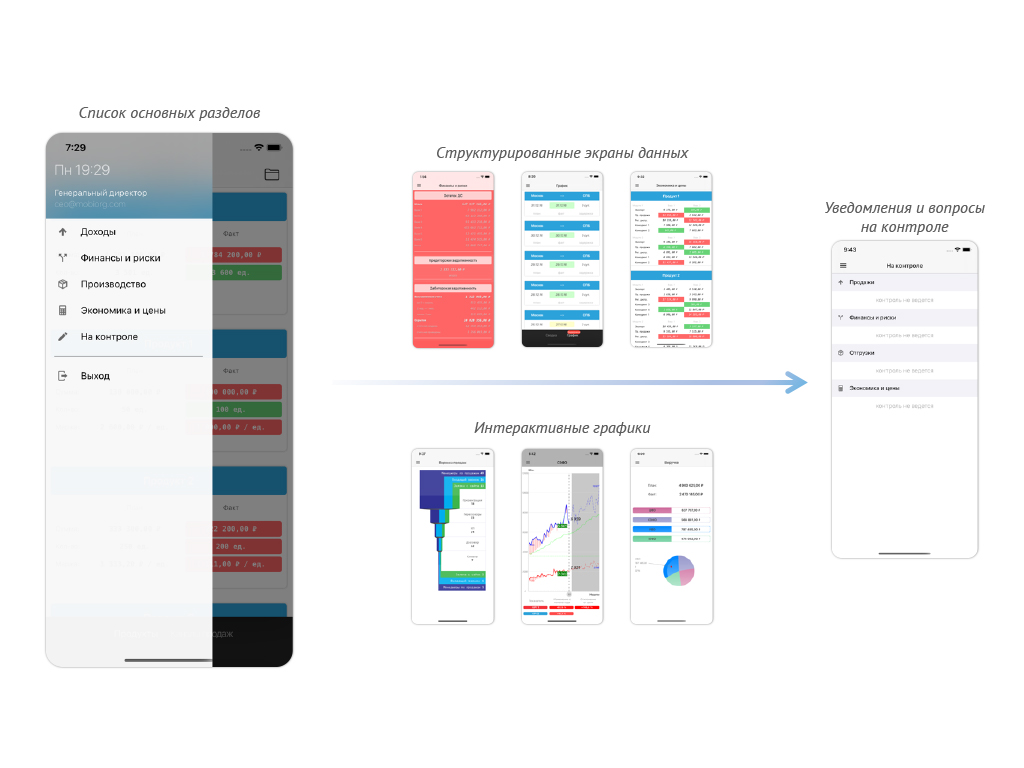
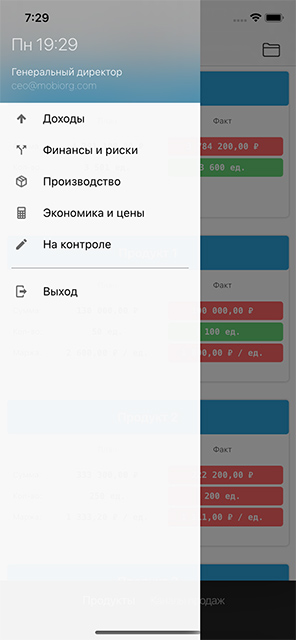
Key Business Metrics
The screen displays a list of the key business metrics of the mobile dashboard.
The list of key business metrics is set when a mobile dashboard is installed.
The screens for each metrics section can include interactive graphics, structured data forms, and notifications.
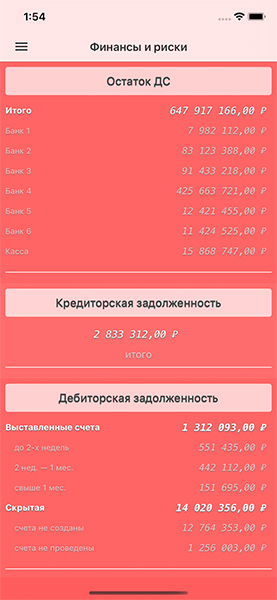
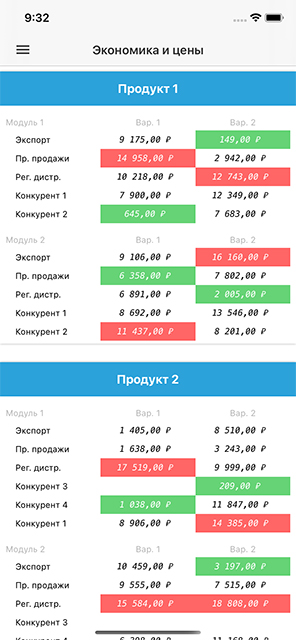
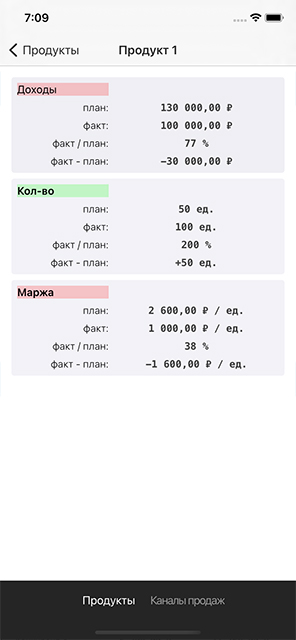
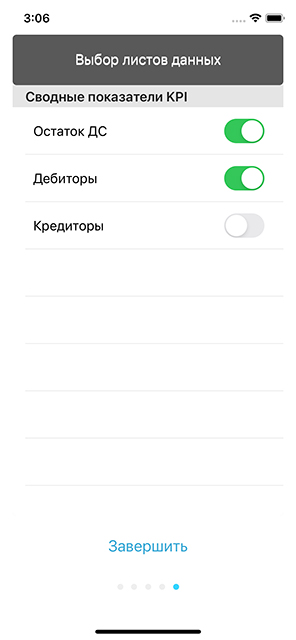
Structured Data Screens
The screens can display a variety of digital and text data with automatic validation of values and corresponding color indication. For example, to compare planned and actual values of any indicator.
Interconnected screens are supported. For example, to drill down different indicators to their components.
It is possible to apply filters and search by displayed and related data.
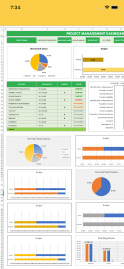
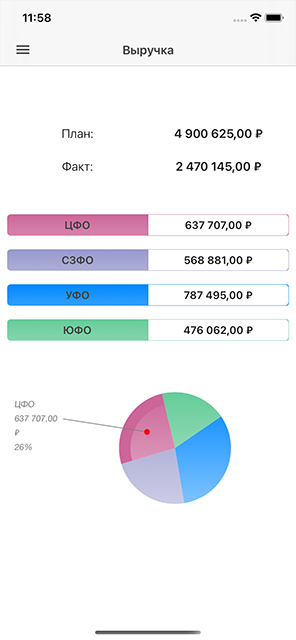
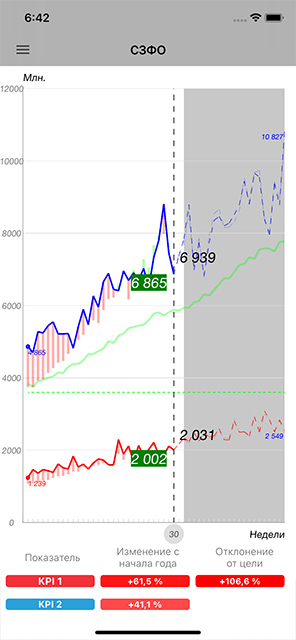
Interactive Charts
Using interactive charts allows to visualize complex and multi-level datasets. For example, get a dynamic display of data for different periods and for different groups of indicators on one screen.
Thanks to interactivity, it is possible to view charts for any day, week, month, year, while quickly switching between actual and planned indicators.
In addition to the graphical presentation of data, spreadsheet can be displayed on the same screen.
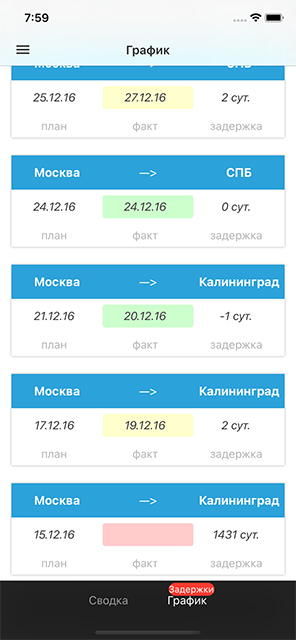
Notification Center
Key indicators and significant deviations from their planned or forecast values can be tracked for instant notifications.
For example, it is possible to track a production plan with notifications when a shipment schedule is delayed, or a revenue budget with notifications when payments are late.

Pricing
At your request, we will provide additional information, as well as prepare the cost and time terms for the development of Mobile Executive Dashboard for your organization.